Our original bullish thesis around housing began in late 2019/early 2020 and we wrote about what we considered an affordable housing crisis on the horizon in our Q1 2020 letter and Q2 2020 letter. Since then, the housing market has exploded higher and is now a lightning rod for takes that range from incredibly bullish to predicting an imminent 2008 style crash. In this series of articles, we’ll be doing a deep dive into various aspects of the US housing market including supply, demand, and affordability, as well as a look at the repair and remodel market.
Let’s start with a look at the supply side and breakdown how we got to this point of record low homes for sale.
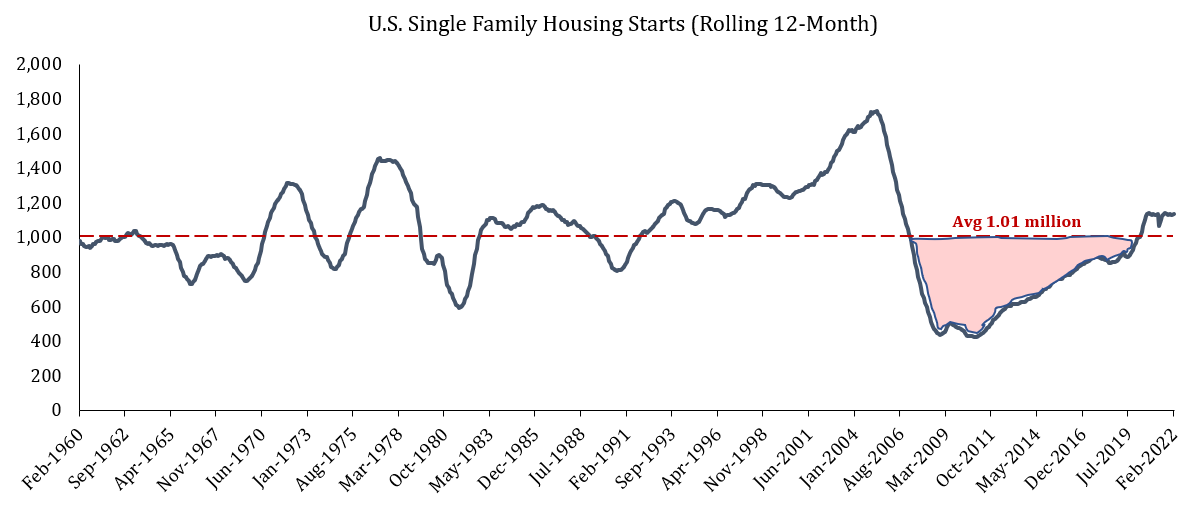
The US Underbuilt for a Decade
Since 1960 we have built 1.01 million single-family homes on average in any 12-month period. Following the peak of the housing bubble in 2007 we then spent 13 years building below that level, even as the population grew and the number of households increased by 14 million over that time frame. In theory, we could build at the current rate of just over 1 million starts for the next two years without a single new unit being occupied and we would only return to an average level of available inventory and the 20-year average home vacancy rate. In other words, we’re just getting back to normal.
How did we get by building at such a low level with millions of households being formed?
We believe a big part of it was due to excess inventory from the 2006-2008 time period that took several years to chew through and absorb. For example, with ~38 million rental units across single family and apartments as of 2009, starting from an 11% vacancy rate in Q3 2009 and slowly grinding down 5.6% means an incremental ~2.05 million units became occupied (~160k units/year).1
Furthermore, the proportion of people aged 25-34 living at home with parents went from 14% to 19.7% for men, and 8% to 12.3% for women from 2005-2021.2 This means an incremental ~1.34 million young men and 973k young women who might have otherwise formed a new household and occupied an additional housing unit instead lived with parents (ignores the number living with other relatives) most likely due to the weak economy coming out of the GFC. This cohort, along with Gen-Z, has likely been saving lots of money by living at home and in our view are now a major source of pent-up demand for new household formation, something we will examine in much more detail in a later post within this housing series.
Additional factors besides just a decade of underbuilding contributing to the current lack of available homes include:
People buying new homes but renting out their old home instead of selling because they’re locked into a low mortgage rate, i.e., taking a home off the market without putting one on to replace it.
Investors buying homes for short-term and long-term rentals – estimated to be 33% of home sales.


Secondary home purchases by wealthy people. 33% of respondents in a recent Knight Frank survey saying the pandemic made them more likely to purchase a second home and 13% of buyers saying their next purchase will be a vacation home.
People deciding to remodel their homes instead of venturing out into the competitive housing market, i.e., “trading up in place.”
One other often overlooked factor to consider in the supply/demand equation is that it is estimated that approximately 0.25% of the existing home stock is demolished or obsoleted each year. This equates to ~350,000 homes which need to be replaced just to keep existing housing stock flat.
Inventory Levels
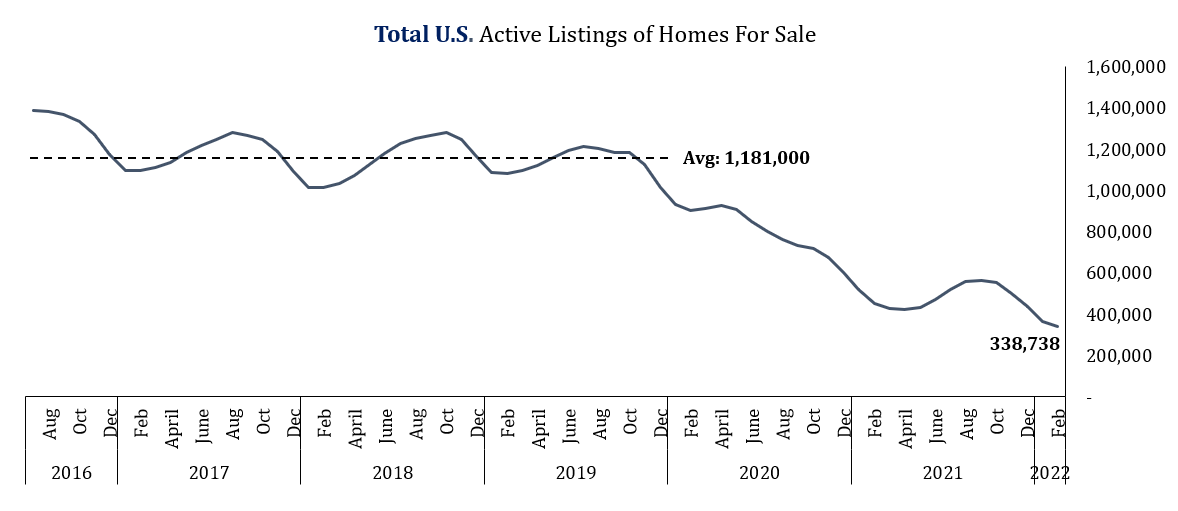
All these factors taken together has resulted in a severe shortage of available homes for sale. Across the US currently there are only 338,738 active home listings as of February 2022. This is down 25% y/y from the already low February 2021 figure and down 71% from the pre-covid average (2016 – 2019).
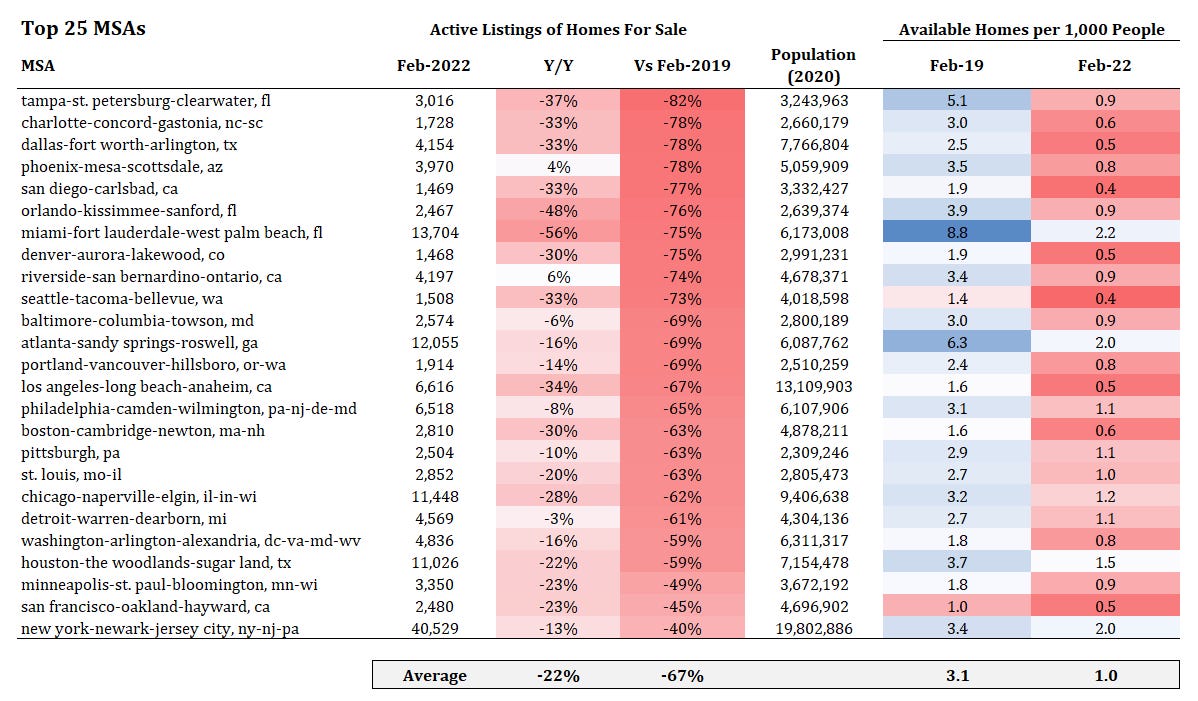
The shortage is particularly pronounced in some of the states which saw an influx of migration over the past two years. In Florida there are only 27,139 homes currently for sale across the top MSAs, down 49% y/y and down 75% from the pre-covid average.
It is a similar story in the Carolinas with less than 11,000 homes for sale across the top MSAs, down 40% y/y and down 80% from the pre-covid average.
The housing shortages are widespread without a single MSA in the top 75 having less than a 40% reduction in available inventory compared its 2016 – 2019 average.
Within the top 25 MSAs, the largest reductions in inventories have come across Florida, Texas, the Carolinas and Arizona. The top 25 MSAs have 22% less homes for sale on average versus a year ago, and 67% less than 2019. Prior to COVID the average MSA had 3.1 available homes per 1,000 people while there is now only 1 available home per 1,000 people.
A similar story exists in the top 26 – 50 MSAs southern/southeastern states seeing the largest drops in inventory. The average MSA in this group has 22% less available homes versus a year ago and 70% less than 2019. Available homes per 1,000 people have gone from 2.9 in 2019 to 0.8.
The smaller MSAs (51st – 75th in terms of population ranking) have seen the largest declines in available homes with 29% less homes vs a year ago on average and 75% less than 2019. These smaller cities came into 2020 with a lot more available homes per 1,000 people than the larger MSAs with 4.1 homes/1,000 people, but now have less than the top 25 MSAs with only 0.9 homes/1,000 people.
So single family home supply is incredibly constrained but what about other living options? If someone isn’t living in a single-family home, then the most likely other option is a multifamily building. Multifamily vacancy rates are currently just 2.4%, their lowest ever. In other words, they’re filled to the brim. Because of this, the median rent for an apartment in the U.S. is up 19.8% y/y, and much higher in cities like Miami (+52%), Tampa (+38%) and Austin (+31%).3
One way to contextualize this vacancy rate is that we could build at the current pace of 500k multi-family unit starts over the next 3.6 years, not have a single person move into any of the new units, and we would just get back to the 30-year average vacancy rate.
Demand
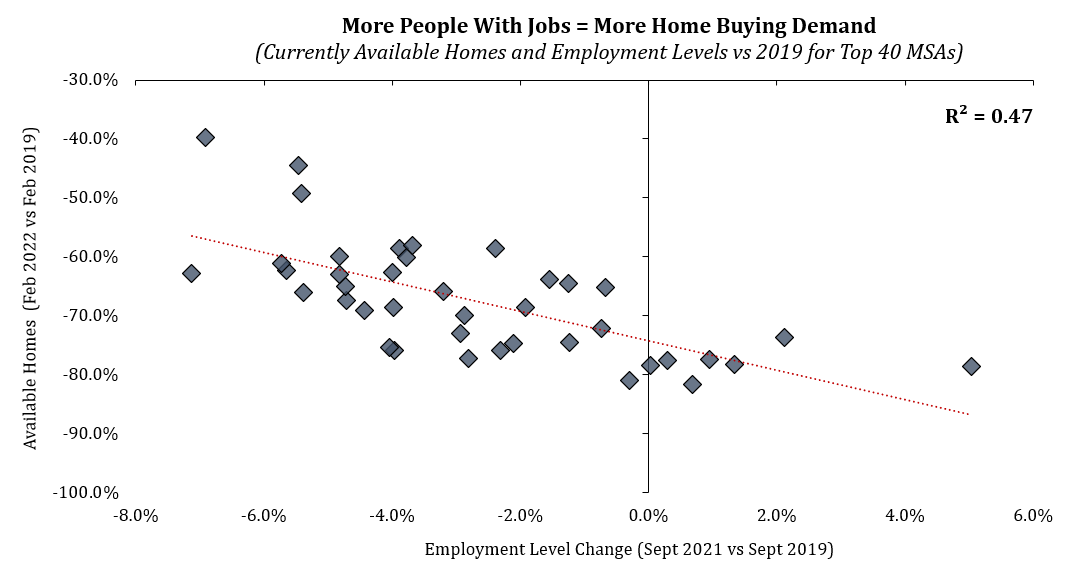
We’ll get more into the demand side of the equation in a future article, but we’ll leave you with this. The chart below shows the change in the number of employed persons in the top 40 MSAs now versus pre-covid relative to the change in available homes now versus pre-covid. With an r-squared of 0.47, the growth in an MSA’s employment level explains nearly half of the reduction in available homes. This makes intuitive sense--more employed people in an area means more need for housing and more people with the means to buy instead of rent.
The level of employment change can be a result of a multitude of factors, but we believe they are mostly explained though population growth due to an influx of people (with jobs) and/or a stronger recovery from the job losses during the depths of the forced government lockdowns.
Interesting to note is that four of the top five MSAs with the best employment growth since 2019 (and thus the most home buying demand) are in Texas or Florida, both red states who had less severe and less lengthy covid restrictions and shutdowns, while the bottom five states are all large cities in blue states which had the most restrictive and lengthy shutdowns.
Conclusion
The long period of under investment in single family homes, combined with the strongest consumer balance sheets in modern history, has created an extreme shortage of housing inventory on a nationwide basis. We will continue to explore this topic with articles on demographics and demand, housing affordability and interest rates, our outlook for repair and remodel spending, and lastly a look at some individual stock picks to express our views.
Freddie Mac
U.S. Census Bureau
https://www.realtor.com/research/january-2022-rent/


Awesome post. Question, you write that there are 338,738 active listings in the U.S. as of February, but in the Realtor.com data I see there are 376,018. You must be subtracting something to get to your number. Can you explain how you arrived at 338,738?