At the end of our last article, we showed that employment growth for a metro area (MSA) was a large driver of the relative shortage of housing in that area, with an r-squared of 0.47. The more employed people in an MSA now vs 2019 meant less available homes in that city. This increase in employment relative to pre-COVID for an area was a function of multiple factors including a quicker recovery of the local economy, less COVID restriction related job loss, and positive net migration to those cities. In this article we’ll take a closer look at these migration trends, the demographic wave driving home buying demand and conclude with how many new homes we estimate need to be built to fulfill expected demand over the next few years.
Migration
Net migration within the US represents a form of shifting demand for housing, not necessarily new demand creation overall. Some people will look at the U.S. as a whole and say there’s 130 million households and 142 million housing units, we’re over built and don’t need new homes. But the overall numbers don’t tell the full story, as the common refrain in real estate goes, “location, location, location.” For example, if there are 50 people living in 50 homes in California and 25 people living in 25 homes in Texas then there is equilibrium with 75 people total in 75 homes. However, when 25 of the people in California people move to Texas, it doesn't matter that cumulatively you have 75 homes for 75 people. You now need to build 25 more housing units in Texas. In other words, demand has shifted geographically, and supply needs to follow. While a simplistic example, the numbers bear this out.
Looking at the Top 50 MSAs, 60% of the decline in available homes for sale in each city can be explained by the net migration flows to those MSAs from July 2020 to June 2021. The most popular cities to move to during COVID now have less available homes for sale.
This is the most recent migration data we have but there’s reason to believe this acute intrastate migration trend isn’t behind us. According to Redfin, in Q1 2022, a record high 32.3% of Redfin.com users were currently searching for homes outside of their current metro areas.
We believe one of the main reasons for this migration is clear - politics. Rightly or wrongly, states and cities’ response to COVID became highly politicized along party lines. The level of restrictions implemented seem to have been what pushed some people over the edge in determining to leave a state. Looking at the 20 most populous states, the severity of the COVID-related restrictions put in place explains half the variance in domestic migration. I.e., the more restrictive a state was, the more people left.
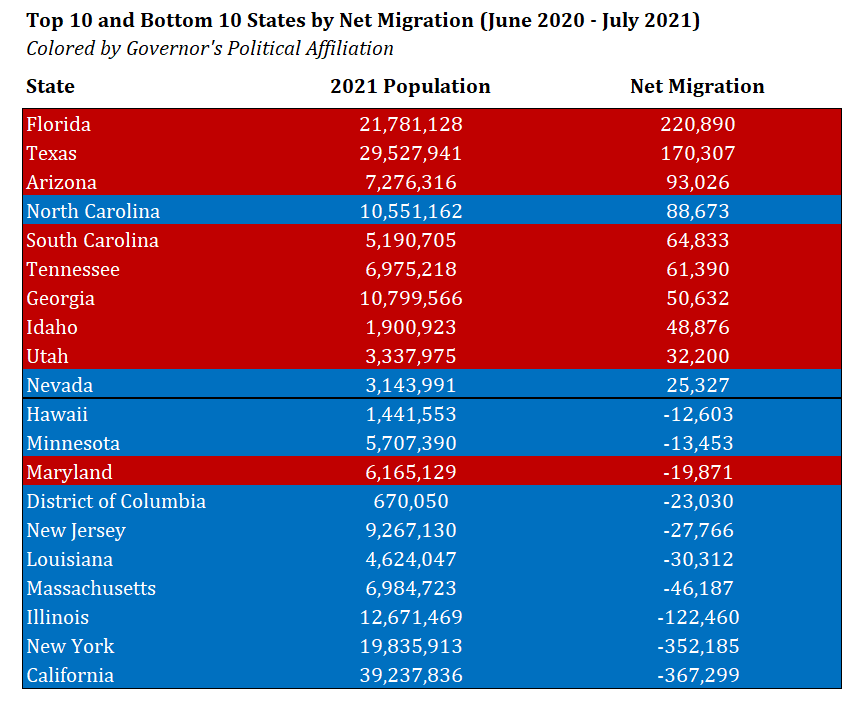
There are other factors when one is deciding to move from one state to another: state taxes, weather, and increasingly important – housing affordability. However, looking at the table below (showing the top ten and bottom ten net migration states color coded by the Governor’s political affiliation), we believe it’s safe to say the restrictions put in place by municipal and state government were the most important facet.
In some cases, the migration from 2020 to 2021 was just an acceleration of ongoing trends, like the outflow from the Northeast, and inflow to the South. But looking at the West region, the reversal in trend is shocking. In the year leading up to COVID (July 2019 – June 2020) the region saw net inflows of people. In the year when restrictions were put in place (June 2020 – July 2021) there was a massive net outflow of people.
First Time Homebuyers
Net migration provided a form of shifting demand that has contributed to the few homes available for purchase in many areas. But more importantly, this depletion of supply happened ahead of what we believe will be an acceleration in a source of new housing demand with the largest cohort of the population currently entering their prime first-time home buying age.
An estimated 4.7 million millennials turned 30 years old in 2020 and another 4.8 million turned 30 in 2021. Over the next three years, there will be an additional 4.8 million entering their 30s each year.1
Why is 30 a magic number? The median age of first time home buyers has shifted over time, increasing from their late 20s in 1980 to 33 years old in 2021. One reason for this is that people are getting married later in life than they used to. The percent of people aged 25 – 29 years old who are married has dropped from 60% in the 1980s to just under 30% now. However, and this is why 30 is the magic number, the percent married jumps to 50% in the early 30s and continues to climb to 62% by the late 30s/early 40s.
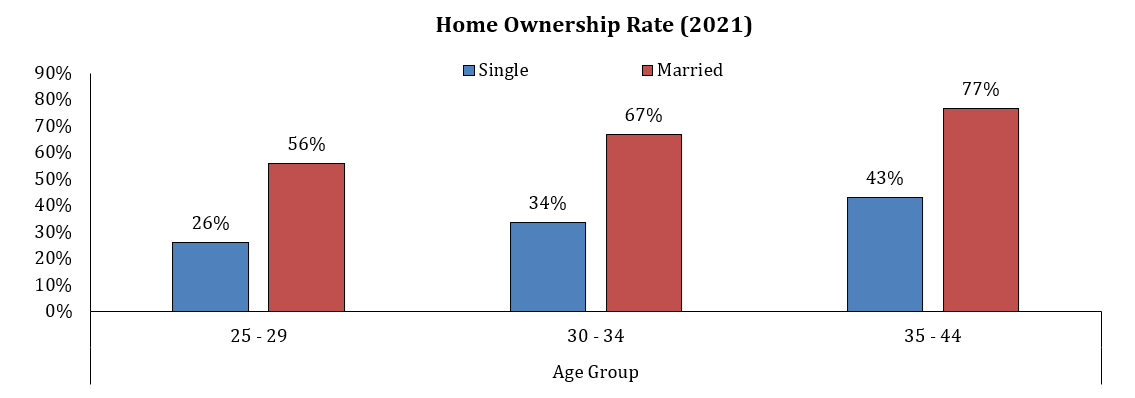
For most people, buying a first home is sparked by life events rather than being a financially driven decision, and getting married is commonly what spurs that first purchase. This is shown by the home ownership rates by marital status and age group. Even in their late 20s, over half of married couples own a home compared to about 1 in 4 single people in the same age group.
In 2022 weddings in the US are expected to top 2.4 million, the highest in forty years.2 While we think it’s reasonable to argue a lot of these weddings are just catch up after all the postponements the last couple years due to COVID restrictions, the fact remains that millions of people are now hitting this pivotal life moment just as factors like migration and second home purchases have depleted available supply around the country over the past two years.
With nearly 5 million people entering their 30s per year for the next three years, we estimate there will be over 2.2 million first time home buyers entering the market to buy a home over the next three years. To be clear, this is new incremental demand for about 740,000 first homes per year just from people turning 30. This wave could easily maintain the high levels of home buying demand we’ve witnessed recently, all while starting from a historically unprecedented low level of supply.
For another broader estimate of coming demand, according to a recent Zonda poll, 29% of all millennials who have not yet purchased a home are aiming to purchase within the next 1-3 years, and 14% are currently trying to buy right now. There are 72 million millennials with a current home ownership rate of 43%. This means that there are over 5.7 million millennials trying to buy a home right now compared to available inventory of ~280,000 homes nationwide. This explains bidding wars that have been ongoing across wide swaths of the country. To us, it’s hard to see how this supply/demand dynamic plays out without necessitating the construction of millions of more homes.
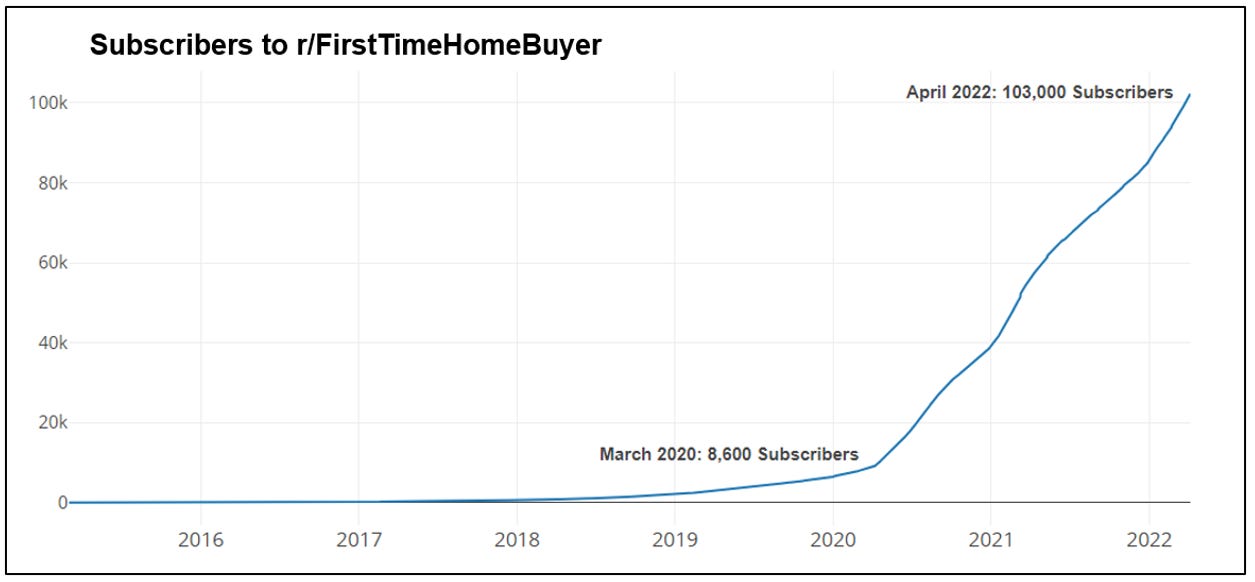
Given these demographic trends, it’s probably not a coincidence that the number of subscribers to the Reddit thread r/FirstTimeHomeBuyer is up 11x since March 2020.
While marriage is a big demand driver, it isn’t the only factor that drives first home purchases. Single people also buy at homes at a certain age. Single women specifically now buy homes at a far higher rate than in the past with 65% of single women now saying they would rather not wait until they were married to buy a home. The home ownership rate for women increased 10.3%, from 50.9% in 1990 to 61.2% in 2019, and single women now own more homes than single men in every one of the top 50 MSAs3.
An additional key driver of demand over the next few years could be the large cohort of young people who have been living at home with their parents moving out. After hovering around 15% from the late 80s to early 2000s, the percent of 25 – 29-year-olds living at home started to rise during the 2008 financial crisis and has now settled around 24%, or ~5.5 million people. On top of this, another 11% of men (~2.5 million) and 15% of women (~3.4 million) in this age range live with a relative that is not a parent. Many of these people have been working and saving money or going to college and have good earnings prospects and a source of new household formation should they decide to get their own apartment or house.
Like the marriage rate, there is a significant change in behavior as people age into their 30s and the percent of people aged 30 – 34 living with parents drops from 24% to under 14%4. While it’s tough to predict with any confidence, any reversal in this trend of people living with their parents to a level more in-line with what we saw from the 1980s – 2007 would result in millions of new household formations.
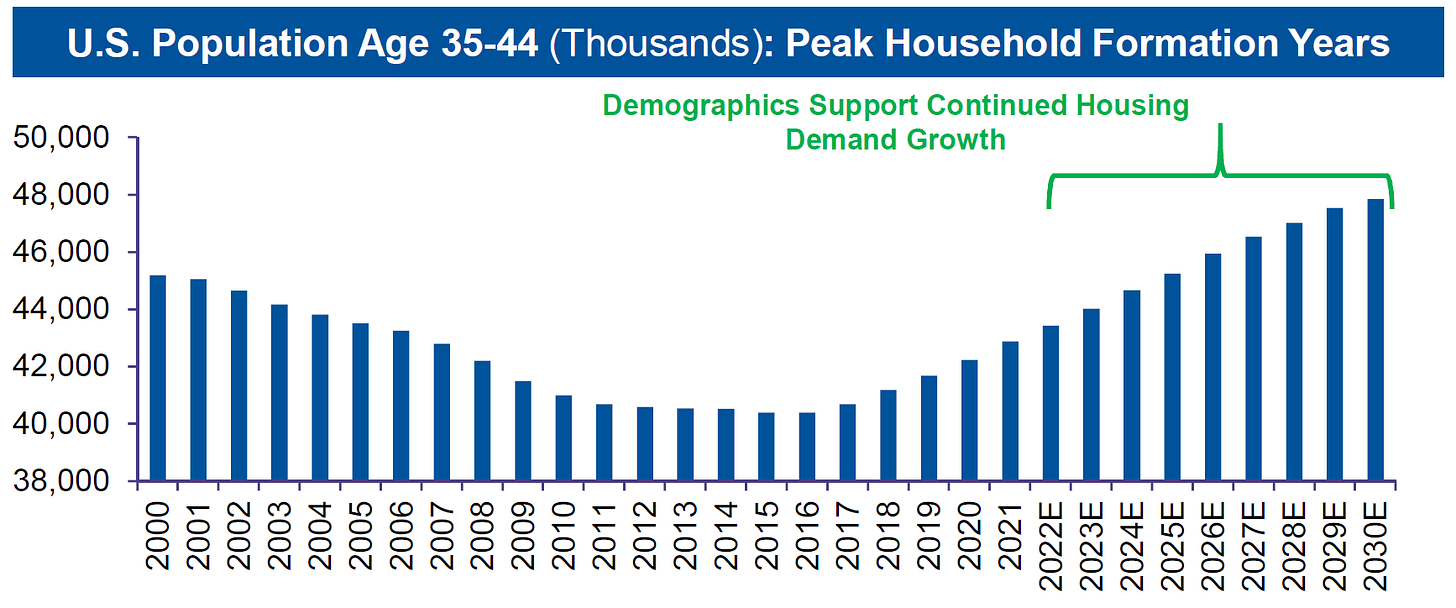
While we’ve mostly looked at the 25 – 34 age range as a pivotal point in people’s lives, the 34 – 44-year-old range is often referred to as the “peak household formation” years. This is when the marriage rate increases from 50% to 60% and home ownership increased from 67% to 77%. The chart below shows a projection for this age group out to 2030. To us, this shows two things: 1) there should be a strong demographic demand floor under housing for years to come and 2) comparisons to the housing bust in 2007 are misguided. In the early 2000s we were building a high number of homes into declines for this key demographic. Today, we are just getting back to a historically average level of home construction as this age cohort is expected to grow for years to come.
Absent a brutal recessionary environment with millions in job losses (there are currently a record 11.3 million job openings) where an even larger percentage of 20- and 30-year-olds move in with relatives, the most likely path to housing market inventory normalization is to accelerate the pace of building or, at the very least, sustain the current level of new construction for many years to come.
Investors
There are roughly 17 million single family rental homes in the US. While institutional buyers like Blackstone get a lot of the media headlines, institutional landlords only own ~2% of the single-family rental homes in the country.5 One sign of the explosion in the number of small landlords is the growth in subscribers to Reddit’s r/RealEstateInvesting message board, up 8x since January 2021 to 1.3 million subscribers.
This infatuation with being a real estate investor and “passive income” has also soaked up available homes for the coming wave of owner-occupied demand described above. According to John Burns consulting, in January 2022, small investors (own < 10 homes) accounted for 27% of all homes bought during the month.


As John Burns also points out, this interest in owning a rental property seems to be particularly popular among young adults.


Second Homes
One additional small but underappreciated ongoing demand driver will be people buying second homes. While cooling from a breakneck pace (reaching +87% in early 2021 vs 2019), second-home demand remains 13% above pre-pandemic levels according to Redfin6. More importantly, the surge over the past two years contributed to the depletion in available home supply for people moving cities and first time home buyers.
Less than 1% of homeowners in the 22-30 age cohort own more than one home compared to >7% in the 66 – 75-year-old age cohort. As wealthy Boomers age into this key range, but are not yet old enough to “age out” of their existing home (the primary home ownership rate climbs from 66 to the late 70s), we expect secondary home purchases to provide sustained incremental demand for several hundred thousand homes per year.
Additionally, >50% of recent vacation home purchases have been paid for in all cash7, so these buyers are much less mortgage rate sensitive than entry level/first time homebuyers. This level of demand may have shifted even higher recently given work-from-home flexibility and the strongest consumer balance sheets in modern history.
Conclusion
In our view, the current housing market is a textbook example of supply and demand imbalances driving up prices. The demand that has resulted in bidding wars and rapid home price appreciation isn’t coming from euphoric real estate speculation. The ongoing wave of demographic driven demand is crashing into a structural housing supply shortage after we spent over a decade underbuilding following the financial crisis. While we don’t want to try to predict housing prices, we think the calls for a housing price crash on par with or even worse than 2007/2008 are sensationalistic as we believe there is a strong demand floor for the foreseeable future.
Pulling it all together, we attempt to quantify just how many new homes we need to build to fulfill demand over the next few years.
We believe most of assumptions that went into this estimate are conservative which include:
Current home ownership trends by age cohort and marital status carry forward
No tear downs (historical average of ~250,000 – 350,000 per year)
No demand contribution from immigration
Steady vacancy rate for homes of ~8% compared to 7.7% - 9.3% from 2015 – 2021
Ignores demand for the under 30 age group
Our current estimate is that we will need to build 5.6 million homes from 2022 – 2025 or an average of 1.4 million new single-family homes built per year.
Next in this series of articles we will assess housing affordability in the context of a historic surge in mortgage rates, home prices, and apartment rents. We will also give an outlook for repair and remodeling spending.
Realtor.com
Signet Jewelers
U.S. Census Bureau
Tricon Residential 2022 Investor Presentation
https://www.redfin.com/news/second-home-demand-drop-march-2022/
National Association of Realtors


