The Big Long? A Deep Dive on U.S. Housing (Part 3)
Part 3 – Homeowner Balance Sheets and Historical Declines in Home Values
The goal of this housing series is to do a deep dive and take a more granular look at supply and demand dynamics in the housing market. However, given the increasing deluge of headlines calling for a housing market crash, we wanted to take a step back and look broadly at homeowners’ balance sheets and previous drops in home values in the U.S.
As Ben Carlson says in his excellent recent article, “following the 2008 financial crisis, a lot of people came around to the idea that housing crashes were normal.” He poses the question “…many are waiting for the next shoe to drop. Eventually housing prices have to crash, right?”.
Homeowner Balance Sheets
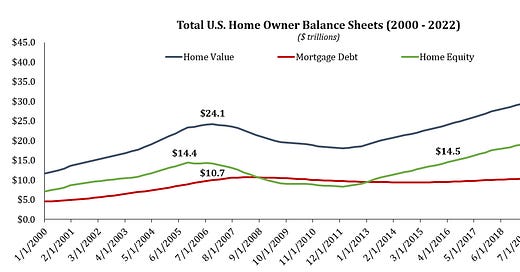
Since the previous peak of the housing market in 2006/2007, U.S. home values have soared while mortgage debt has stayed relatively flat. Mortgage debt now stands at $11.7 trillion, up just $1 trillion from its prior peak in 2008. Over roughly the same period home values have increased by $14.1 trillion to $38.1 trillion. This has resulted in total home equity growth of $12 trillion since late 2005 to $26.4 trillion today. It’s interesting to note that homeowner equity didn't fully recover its 2005 peak until mid-2016, a sign of just how devastating the housing crash was.
Looking at just the past couple years, the rise in home values and home equity since 2019 have outpaced the growth in mortgage debt by over 2x and nearly 3x, respectively.
Since 2019:
Total home values: +$8.1 trillion, +27%
Mortgage debt: +$1.3 trillion, +12%
Home equity: + $6.9 trillion, +35%
The elimination of the excess that accumulated leading up the housing peak in 2006 combined with continued mortgage paydowns, tighter lending standards and rising home values has resulted in a total U.S. mortgage debt to home equity ratio of 46% today, just 1% off the low since 1965 and 14% below the 56-year average.
One way to think about this is that assuming flat mortgage debt, nationwide home values would have to crash 18% for the mortgage debt/home equity ratio to just return to its historical average of 60%.
As another comparison, at the peak of the housing bubble in late 2006, the mortgage debt/home equity ratio stood at 70%, 10% above the historical average and 24% higher than today. A return to this level would require a 25% crash in home prices, matching the severity of the 2007 crash (in the next section we’ll look at just how common a widespread drop in U.S. home values like that is).
As it stands today, U.S. homeowners balance sheets are strong and rarely have people owned more of their homes than they do right now with home equity as a % of home value just shy of an all-time high at 69%.
Historical Drawdowns
The argument of many calling for a crash in home prices can be summarized as “home prices are up a lot over the past two years, thus they have to come down.” Anecdotally, many potential buyers seem to be thinking the same and waiting for a drop in prices before buying.
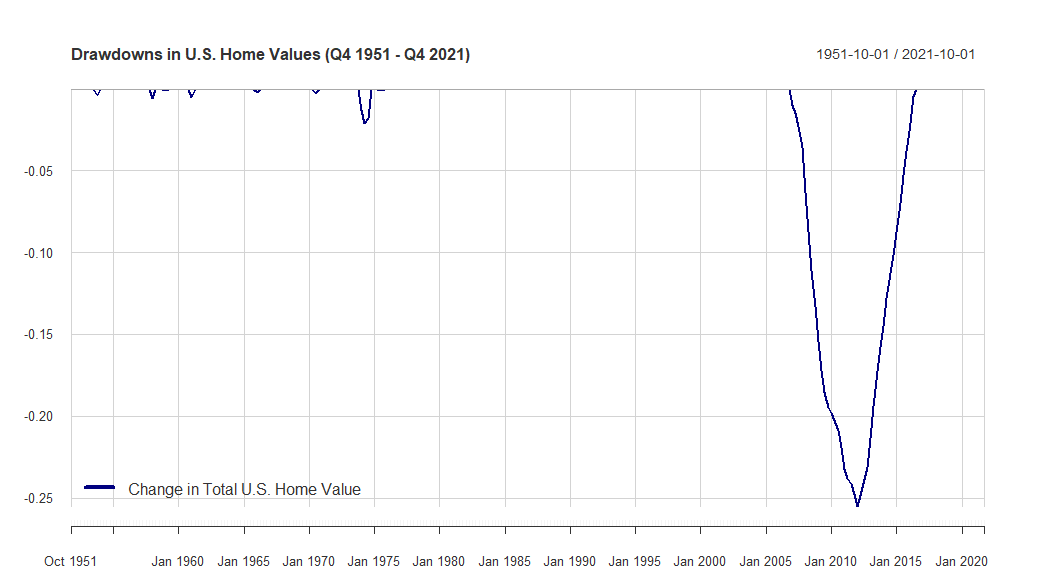
Unfortunately for these buyers waiting, this highly anticipated crash may not come. Broad nationwide declines in U.S. home values are incredibly rare historically. The unprecedentedly low supply after a decade of underbuilding makes a drop in home prices perhaps even less likely. Outside of the financial crisis there aren’t really any nationwide drops in home values to speak of since at least the 1950s.
Below are the nine worst drops in home values since 1951 (we tried to do top ten but there's only nine on record). The crash of -25.5% during the financial crisis was over 10x worse than the next closest drawdown. The disastrous 2007 crash took 21 quarters to bottom (Q1 2012) and another 18 quarters for overall U.S. home prices to return to a new high (Q3 2016). The second worst drawdown in 1974 of 2.1% bottomed after 2 quarters and made a new high 2 quarters later.
In fact, there are only 30 quarters in the past 70 years (281 quarters) where overall U.S. home values declined q/q. Of these 30, 21 were during the 2007 – 2012 time period.
Conclusion
In our view, many of the bearish housing arguments tend to look at things too simplistically and/or on an aggregate national basis. For example, looking at overall national population growth and total U.S. median home price/median income. In all things real estate related one almost always needs to evaluate the state of the market on a more granular level. So while we don’t want to fall prey to this analytical mistake of looking at things too broadly either, we did want to point to some historical data to counter the vaguely bearish tweets and articles calling for a nationwide crash in home prices.
The overall U.S. housing market isn’t the stock market, broad 10%, 20%, etc. corrections in home values are not common. Outside of 2007 – 2012, there has been only one 2% decline in the past 70 years, and this period includes every kind of economic regime imaginable. This isn’t to say it can’t happen, it did in 2007 when bulls and mortgage underwriters were making the same claims that price have rarely declined historically and that didn’t turn out so well. However, the two environments are vastly different given the lack of supply, demographically driven demand trends, and strong balance sheets and buyer credit profiles. This makes it hard to see any widespread significant drop in overall U.S. home values, let alone one on par with or worse than 2007.
In our next couple articles we will dive into housing affordability on an MSA-by-MSA basis and look at the outlook for repair & remodel spending.


Good feedback guys. We intentionally wanted to zoom out for this one to put things in perspective but agree on needing to take a more granular approach and incorporate the human element. We'll be doing in the next article looking at affordability.
The first three parts of this series have been a joy to read - thank you for sharing these analyses. I'm looking forward to more.